ARTICLE · August 2026
Five cases, one consistent lesson
I built a synthetic fintech model to examine five Customer Intelligence decisions. The result was consistent: segmentation, churn, next-best-offer, ARPU and incrementality changed because of definitions established before the model.
Much of the published material on Customer Intelligence begins with the algorithm: select an estimator, fit it and report the AUC.
Leading this discipline across telecommunications, media and fintech has taught me that the most consequential decisions often happen earlier: when defining the population, observation window, contact policy or causal question.
To test that hypothesis, I built a synthetic data model with an explicit causal structure and developed five connected cases — segmentation, churn, next-best-offer, ARPU and incrementality. Each case reuses the decisions and artifacts established by the preceding ones, so the collection operates as one system rather than five isolated exercises.
In all five, the headline metric was shaped by a decision made before the model.
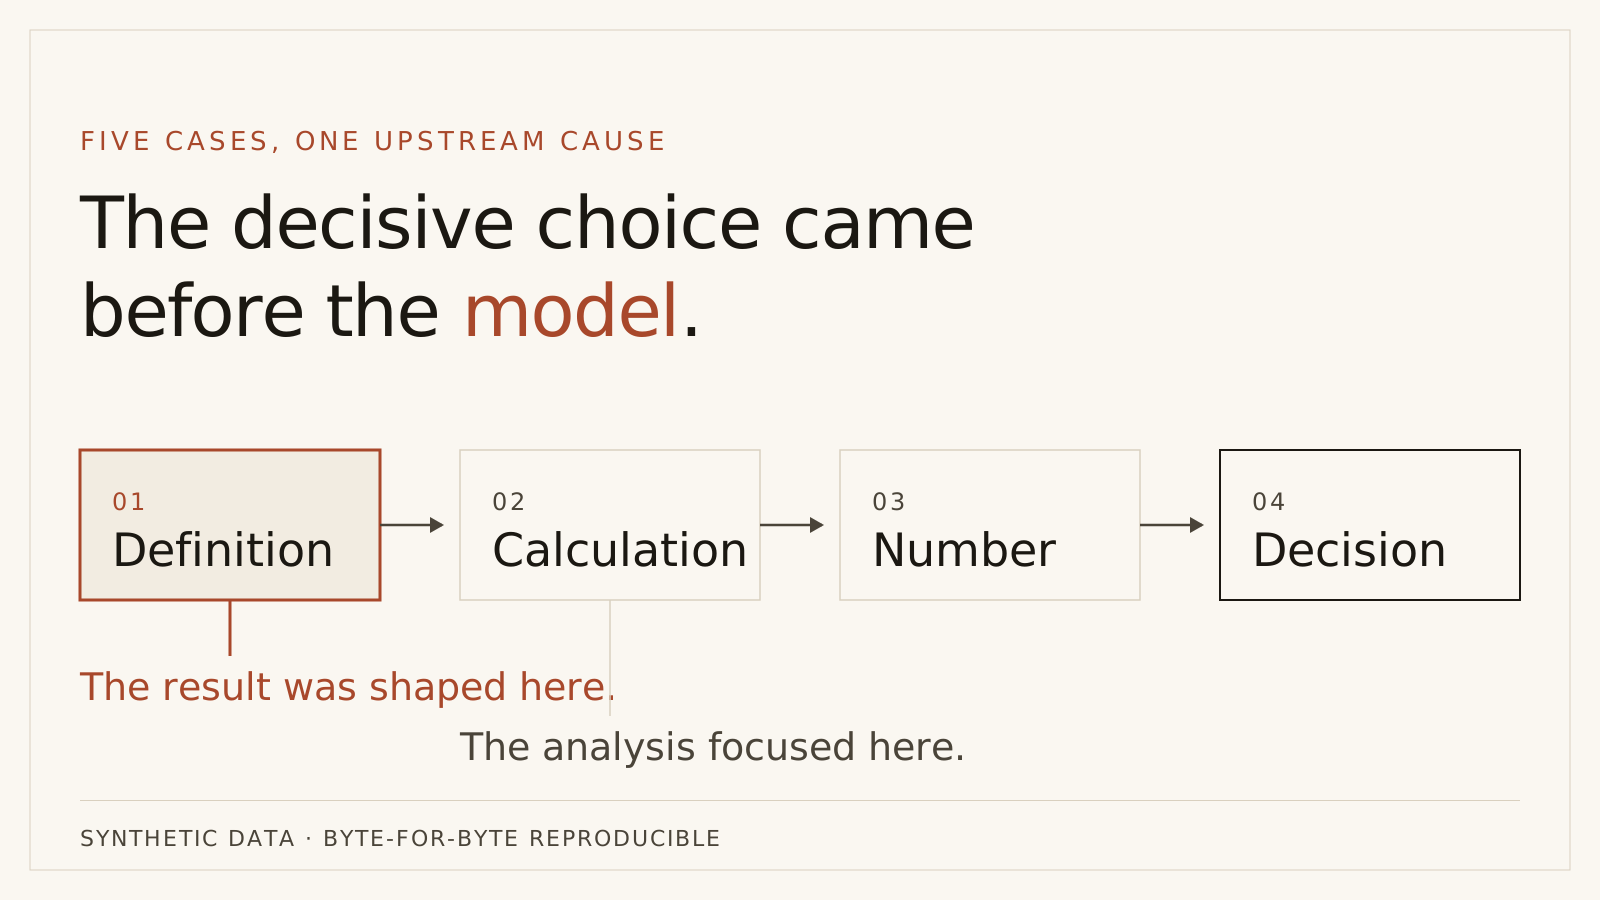
Five cases, one upstream cause
| Case | The decision that changed the result |
|---|---|
| Segmentation | On a subscription, RFM's recency has one distinct value across 4,376 customers: everybody was invoiced last month, because that is what a billing run does. And frequency correlates 1.0000 with tenure — not strongly related to it, it is it. Two of the three dimensions measure the company's own schedule, not a customer decision. |
| Churn | The ranking survives the time gap; the calibration does not. Re-sorting the same probabilities by expected value instead of risk leaves two lists sharing just 43.9% of their names and +1,824 in profit on the same budget. |
| Next-best-offer | The governance gates do not exclude a random sample. The cool-off rule, often treated as an operational constraint rather than a targeting decision, excludes 397 customers who then churn at 24.4% against a base of 11.8%: they were contacted last quarter for being high risk, and are barred this quarter for having been contacted. |
| ARPU | 98.03% of the variance in what customers are billed is between tariffs, not within them. ARPU is the price list. The standard question — do heavy users generate more revenue? — answers +0.30 in aggregate and −0.02 inside any single product. |
| Incrementality | Two identically designed campaigns on the same base report +0.02 pp (no observable effect) and −8.08 pp (a material, statistically significant reduction). The dataset's answer key shows the first one did deliver −4.75 pp and the draw cancelled it out. Neither could reliably detect an effect smaller than ~10 pp. |
Across all five cases, the decisive complexity sat upstream of modeling.
A dataset designed to make causality observable
This thesis can be illustrated with anecdotes, but demonstrating it requires an environment where the causal answer is known in advance.
So the data model came first, and it has three properties the cases need and a public dataset will not give you:
- The churn label is emitted at two different observation cutoffs. That is what lets a case train on the past and score the future, rather than assert that it did.
- The contact policy is a table, not a constant in whichever script is scoring. A policy that lives in code is not a policy — it is a preference: unauditable without reading Python, and different in every team's copy.
- There is an answer key — what each customer would have done had the campaign never run. It exists to validate estimators and remains isolated from the process that produces them.
That third property is what turns the incrementality case into a demonstration rather than an opinion: the observed difference can be decomposed into what the campaign delivered plus the imbalance introduced by random assignment, making the dominant effect visible.
The discipline of withdrawing a conclusion
I wrote an entire section of the ARPU case on the premise that collection shortfall concentrates among customers about to leave. The mechanism is in the data model, so it was a reasonable premise. When measured, the relationship has no stable sign: five partitions of the same base span −0.005 to +0.053.
I removed that section. I did the same with a claim that appeared to be a general rule: "a constant cannot re-order a ranking." The claim proved false because offer cost can change the order. The case retains that result as a control, and the final conclusion is more precise because of it.
All five reports also document their constraints. Evidence is more useful when it distinguishes what a system demonstrates from what it cannot yet support.
Scope and validity of the evidence
The data is synthetic by design: no employer or customer data is part of the lab. That decision protects confidentiality and makes the causal answer observable, but it also limits external validity. The generating process is known and stationary, so the cases do not reproduce every source of complexity in live operations, such as missing history, merged accounts, product migrations or delayed billing.
Within that scope, the lab does provide reproducibility: two runs of any case produce byte-for-byte identical results, and 128 tests run on every push. The cases are classified as reference: complete, working reference implementations without a promise of ongoing product maintenance.
Reproducible evidence
The whole track is in data-intelligence-lab: the data model generator, the five cases with their pipelines, and one report per case with the numbers and the limitations.
The relevant question is not only whether the model was correct, but which definition shaped the result and which business decision followed from it.
Ronald Mego
Data & Analytics Executive
I write about decisions, systems and evidence across data strategy, Customer Intelligence and Agentic AI.